III. Strong Coriolis deflections
A remarkable feature of the deflection effect is, however, that on geographical scales it can become strong. When the deflection $D$ is not much smaller than the extension in space, $L$, of the phenomenon, our estimate given for $D$ in section I. is no longer valid. Nevertheless, the ratio $$ \boxed{S=\Omega_V L /U} $$ can still serve as a suitable measure of the strength of the Coriolis deflection (although $S \neq D/L$) in a motion of typical speed $U$ (with $\Omega_V$ replaced by $\Omega$ when dealing with deflections on carousels). Indeed, if this ratio is on the order of unity, we can be sure that the deflection is comparable to the total displacement. The deflection effect proves to be strong if this ratio is larger than 1.
13. Estimate the strength $S$ of deflection a) for the paper sheet experiment and b) in the corousel video (video2) with the typical length scales as $L=10$ cm and $L=1$ m, respectively. Other typical values are (see answer to excercise 2a) $\Omega=\pi/10$ 1/s, $U=2$ cm/s for a), and $\Omega=\pi$ 1/s, $U=0.5$ m/s for b).
The ratio $S=\Omega L /U$ is $\pi/2=1.6$ in a), and $2 \pi=6.3$ in b). The fact that we consider the deflection strong if the ratio is larger than unity is in accordance with both the carousel video (since deflection may result in a complete return of the ball there) and in the paper sheet experiment (otherwise it would have been very difficult to see the difference between the two lines drawn). Note that from the value of the Coriolis accelerations alone one would not be able to conclude that the deflection is strong in both cases (see solution to Excersise 2a).
14. Consider the case when the ball
returns to the kid rolling the ball in the carousel video, and assume that the path of the ball (friction is negligible)
goes through the center of rotation when observed from outside the carousel. Assuming the distance of the kid is $r$
from the center and the angular velocity is $\Omega$, what should be the tangential initial velocity of the ball on the
carousel (in which direction?) in order to make the ball move like that? How should the radial velocity be chosen in
order to ensure a full return of the ball, after half a revolution?
Consider the case when the ball
returns to the kid rolling the ball in the carousel video, and assume that the path of the ball (friction is negligible)
goes through the center of rotation when observed from outside the carousel. Assuming the distance of the kid is $r$
from the center and the angular velocity is $\Omega$, what should be the tangential initial velocity of the ball on the
carousel (in which direction?) in order to make the ball move like that? How should the radial velocity be chosen in
order to ensure a full return of the ball, after half a revolution?
The tangential velocity of the ball should cancel the tangential velocity of the carousel, it should be $r \Omega$ to the right. A stationary observer can see a uniform motion of velocity $v$, along a diameter $2r$ in time $t=2r/v$. For full return after half a revolution, $t=\pi/\Omega$, and this leads to $v=2 r \Omega/\pi $.
It is a remarkable property of the expression for the strength $S$ that it increases with length. With a given velocity, the greater the extension of the motion in space, the larger the strength of the effect. This shows that, in spite of the slow rotation of Earth, strong deflections are present on large, geographical scales. In large-scale motion of the atmosphere and of the ocean Coriolis deflections are never negligible. In fact, the Coriolis force exceeds most of the other forces.
15. Estimate the strength $S$ of deflection on the Earth at mid latitudes a) for a wind blowing with $U=10 \text{ m/s}$ in a cyclone of size $L=1000 \text{ km}$ and b) for an oceanic eddy with a radius of $L=100 \text{ km}$ in which water moves with velocity $U=1 \text{ m/s}$.
The ratio $S=\Omega_V L /U$ is $5 \cdot 10^{-5} \cdot 10^6/10=5$ in a cyclone (a), and $5 \cdot 10^{-5} \cdot 10^5/1=5$ in an oceanic eddy (b). The fact that the numbers are equal, indicates that the effect of the Coriolis force is of equal importance in the atmosphere and in the oceans.
Cyclones as atmospheric sinks
Mid-latitude cyclones are known to bring rain. This is due to a low pressure region (L) in their center, causing the upwelling of wet air from the surface which then leads to precipitation.
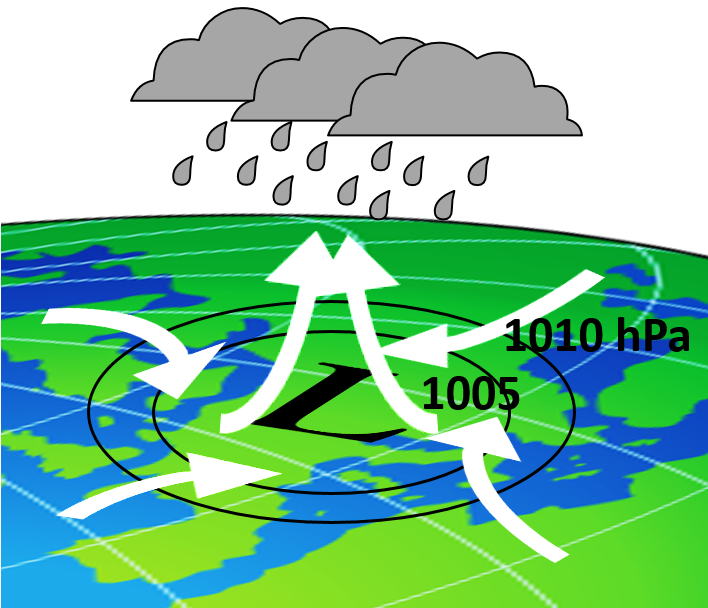
Upwelling can only be present if there is a flow toward the center in the lower layers. Thus the figure
used when discussing water draining from a bathtub, is perfectly valid for the air flow towards the center of cyclones. Air parcels are exposed to the Coriolis effect and turn, on the Northern Hemisphere, to the right (on the Southern Hemisphere to the left). The consequence is a huge air vortex spinning in counter-clockwise (clockwise) direction. It can be considered a gigantic plughole vortex draining upward.
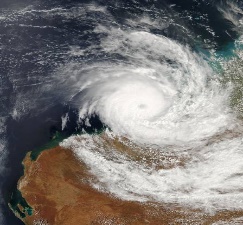
All cyclones follow this rule without any exception! This is so since, as we saw, hardly any other effects can compete with the Coriolis effect on large scales. What was found to be negligible in our plugholes, is robustly present in every-day weather forecasts dominated by cyclones. Cyclones always rotate as the Coriolis force dictates. (Anticyclones rotate in the opposite direction to cyclones but — lacking the clouds to trace out the spiraling motion — they are not visible in weather maps.) At the Equator, without an $\Omega_V$ and, therefore, withut a deflection effect, cyclones do not exist! (Note that tropical cyclones, or hurricanes, are not equatorial cyclones: they occur above 15 degrees to the North or the the South only.) How could then the plughole vortices seen in the very first video be caused by the Coriolis effect? This deceptive video, and many others of the same kind on the internet, are fake demonstrations.
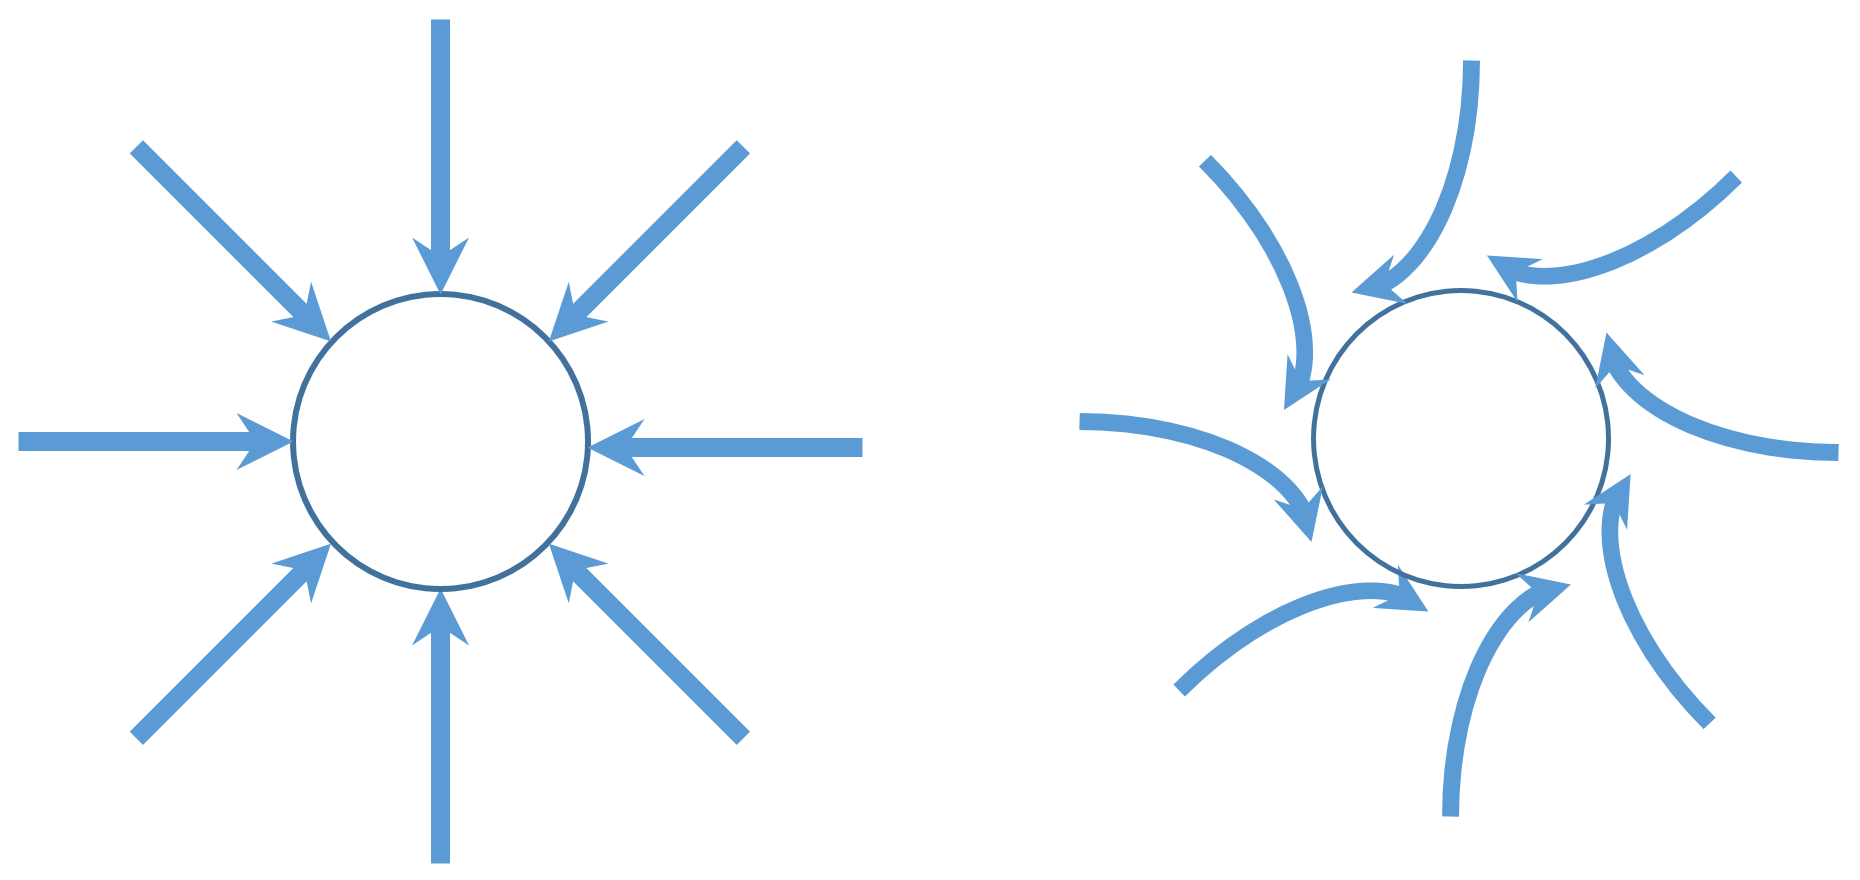
Air does not blow in the direction of pressure drop but at right angles to it
There is a single force which is comparable to the horizontal component of the Coriolis force on large scales. This is the pressure force arising from horizontal pressure differences. The direction of this force (from higher to lower pressure) is the direction in which the material is pushed. Acceleration is brought about by the resultant force acting on air (or fluid) masses. Since velocity changes are rather slow in the atmosphere and in the ocean, the acceleration can practically be neglected. Accordingly, the Coriolis force $\boldsymbol{F}_C$ and the pressure force $\boldsymbol{F}$ originating from horizontal pressure differences balance each other. The vectors $\boldsymbol{F}_C$ and $\boldsymbol{F}$ are opposite to each other, as the figure shows for the Northern Hemisphere (the straight lines represent curves of constant pressure, isobars, and force $\boldsymbol{F}$ points from larger to lower pressure).
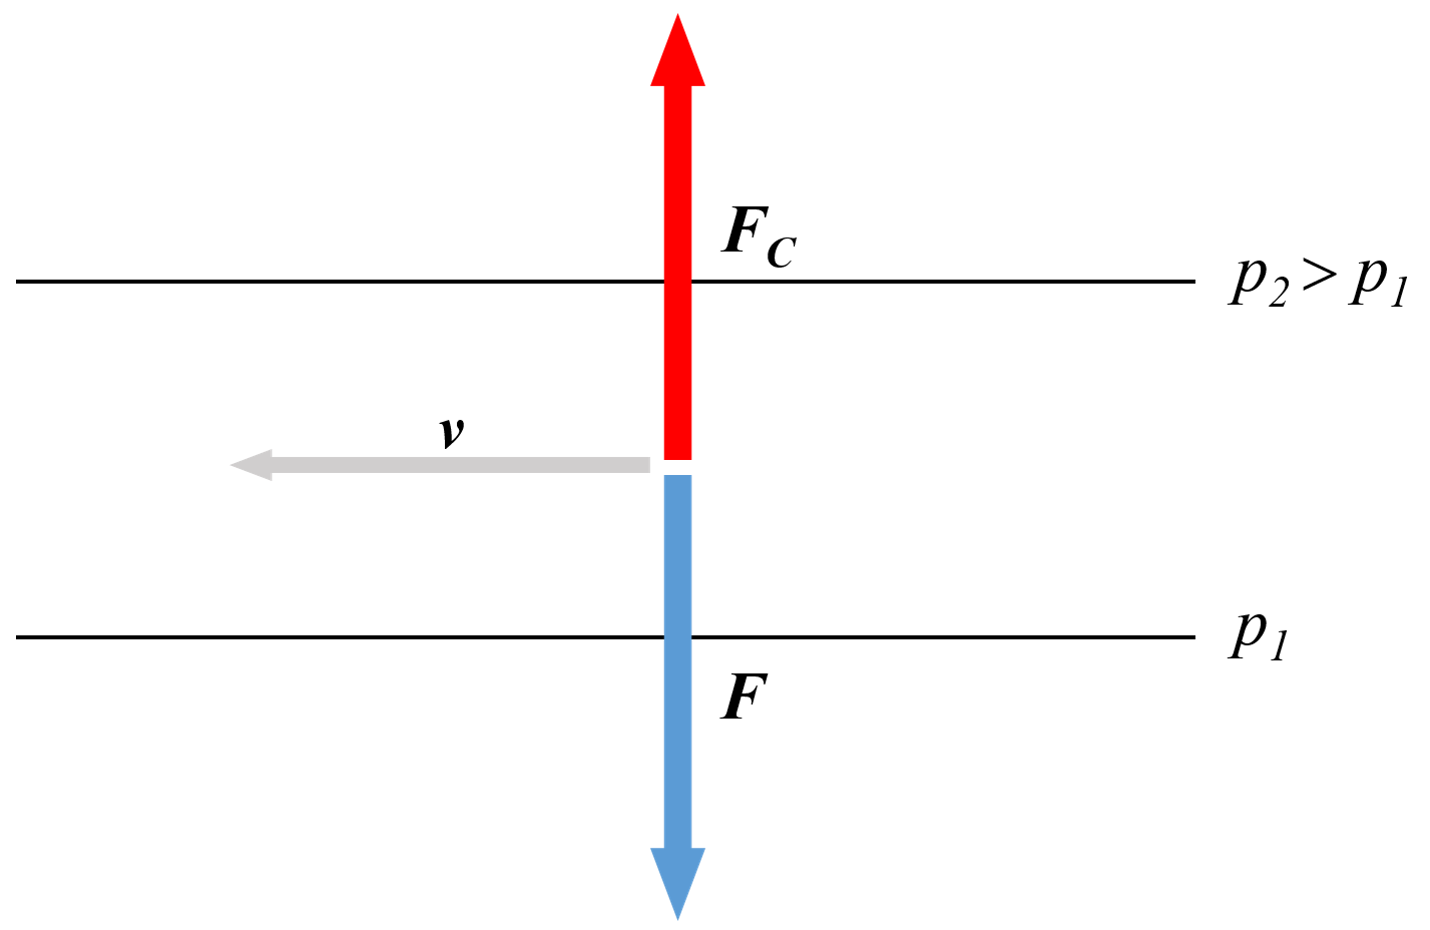
The velocity vector $\boldsymbol{v}$ is, however, perpendicular to the Coriolis force, and therefore velocity is perpendicular to the pressure force, too. As a result, the air or the water masses do not move in the direction they are pushed, but at right angles to the direction of the pressue difference. This is in conflict with everyday experience, e.g. flow in a pipe, where the fluid moves in the direction it is pushed. No wonder, the Coriolis force is very weak on small scales.
The tendency of moving perpendicular to the driving force can be seen in a simple ball experiment on a carousel. Take a slope with a low tilt angle and release a ball on it from rest. Initially, only gravity acts (the analogue of the pressure force) and the ball starts moving down the slope. With increasing velocity, the Coriolis force increases and a motion evolves along a spiral-like path in which the resultant displacement is practically horizontal, i.e., perpendicular to the pressure force. In video7 the slope is tilted towards the bottom of the picture.
The weather map
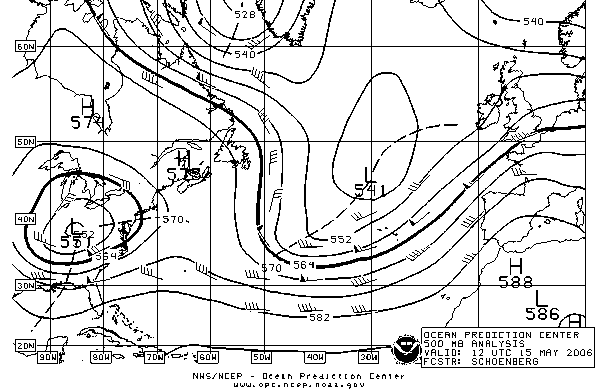
As a surprising consequence of the orthogonality of the velocity and the pressure force, the isobars of a weather map, that is, lines of constant pressure, run parallel to the wind arrows so that higher pressure values are on the right of the arrows on the Northern Hemisphere. A historical predecessor: Buys Ballot's rule.
Buys Ballot's rule
For winds in the Northern Hemisphere, the Dutch meteorologist formulated the following rule in 1857: if you turn your back to the wind, the low pressure will be to your left.
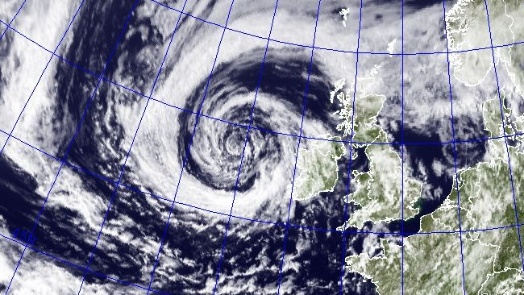
On the left and in the middle of the figure, two cyclones can be seen: closed isobars with the lowest values (L) in the middle, and wind blowing in counter-clockwise direction.
On the internet, find similar pressure maps showing present-day wheather.
Water surface is tilted above oceanic currents
For oceanic currents it is a surprising consequence of the balance between the Coriolis and the pressure forces that the water surface is not horizontal above currents: it is slightly tilted. The reason for this is that in slow flowing motions, pressure at some depth basically equals hydrostatic pressure which, in turn, is proportional to the height of the water column. The horizontal pressure difference is thus accompanied by a height difference. If an oceanic current is present with a certain velocity, the height of water should be larger on the right side on the Northern Hemisphere.
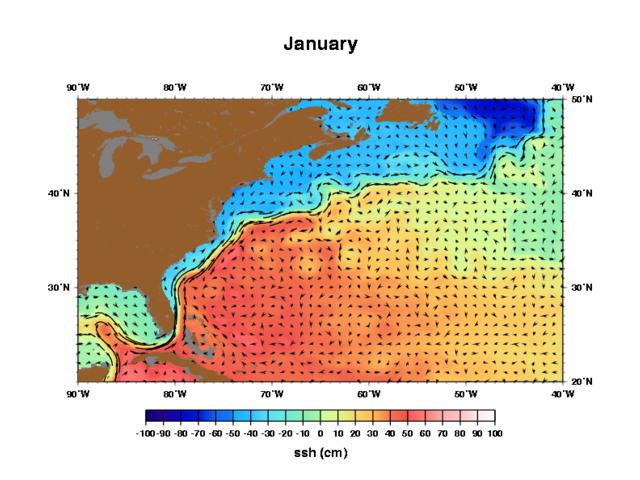
The figure shows the average elevation of the sea level (over a month's period, during which waves are averaged out) above the Gulf Stream. Arrows indicate flow velocities and colors indicate the elevation above sea level relative to a reference value (given in cm above mean sea level). On the right of the Gulf Stream (longest arrows) elevation is about $60$ cm, and $-40$ cm on the left. The total level difference is thus 1 m across an approximately $100-$km-wide current. Eddies turning counter-clockwise are clearly discernible as orange patches within the red region since they have a pressure minimum in their centers.
16.Learn
about quantitative relations
and apply them to estimate typical atmospheric and oceanic velocities.
Laboratory experiments with fluids to demonstrate strong Coriolis deflection in nature
You have seen that the strength of deflection in the plugholes at home is on the order of $10^{-4}$. The low value is derived from the slowness of the Earth's rotation which is just 1 turn over a full day. Strong deflections may be achieved with laboratory equipment rotating about 10 000 times faster. Since one day is 1440 minutes, such a rotational speed is not irrealistic, you just have to produce a few revolutions per minute (a lot slower than a CD player). In fact, experiments carried out with rotating tanks filled with fluids not only show strong deflections but, with properly chosen parameters, can faithfully imitate the essence of large scale atmospheric or oceanic flows.
17. Show that if you can see a fluid pattern of size $L=10$ cm due to a fluid velocity of $U=1 \text{ cm/s}$ in a tank rotating with 5 revolutions per minute (rpm), the strength $S$ of deflection has exactly the same value as in a cylone or in an oceanic eddy.
In such a case the rotation period is $T=12$ s. The angular velocity $\Omega = 2 \pi/T \approx 0.5$ 1/s. The ratio $S=\Omega L /U$ is thus $0.5 \cdot 0.1/0.01=5$.
To illustrate the strong analogy with nature, take a cylinder with a radius of $25$ cm, filled with water up to a height of $10$ cm, and rotate it with a speed of a few rpm. Inject dye abruptly from above. When reaching a depth of a few cm, an interesting pattern evolves as video8 shows.
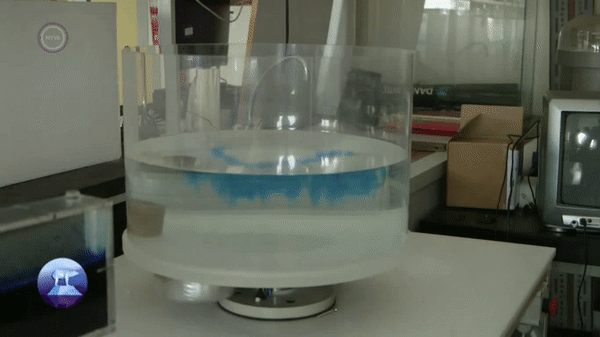
One sees a dye curtain evolving (non-existent in stationary fluids!). The identical motion of the dye at any height is a consequence of the Coriolis deflection which only depends on the horizontal dye velocity (the same for any dye particles right after injection, and at any time later), and is thus independent of the height. The dye curtain persists and becomes wavy (when observed from above) due to emerging vortices next to each other, rotating in counter-clockwise or clockwise direction, the analogs of cyclones and anticyclones. The pattern is rather similar to that of Polar Light (Aurora Borealis).
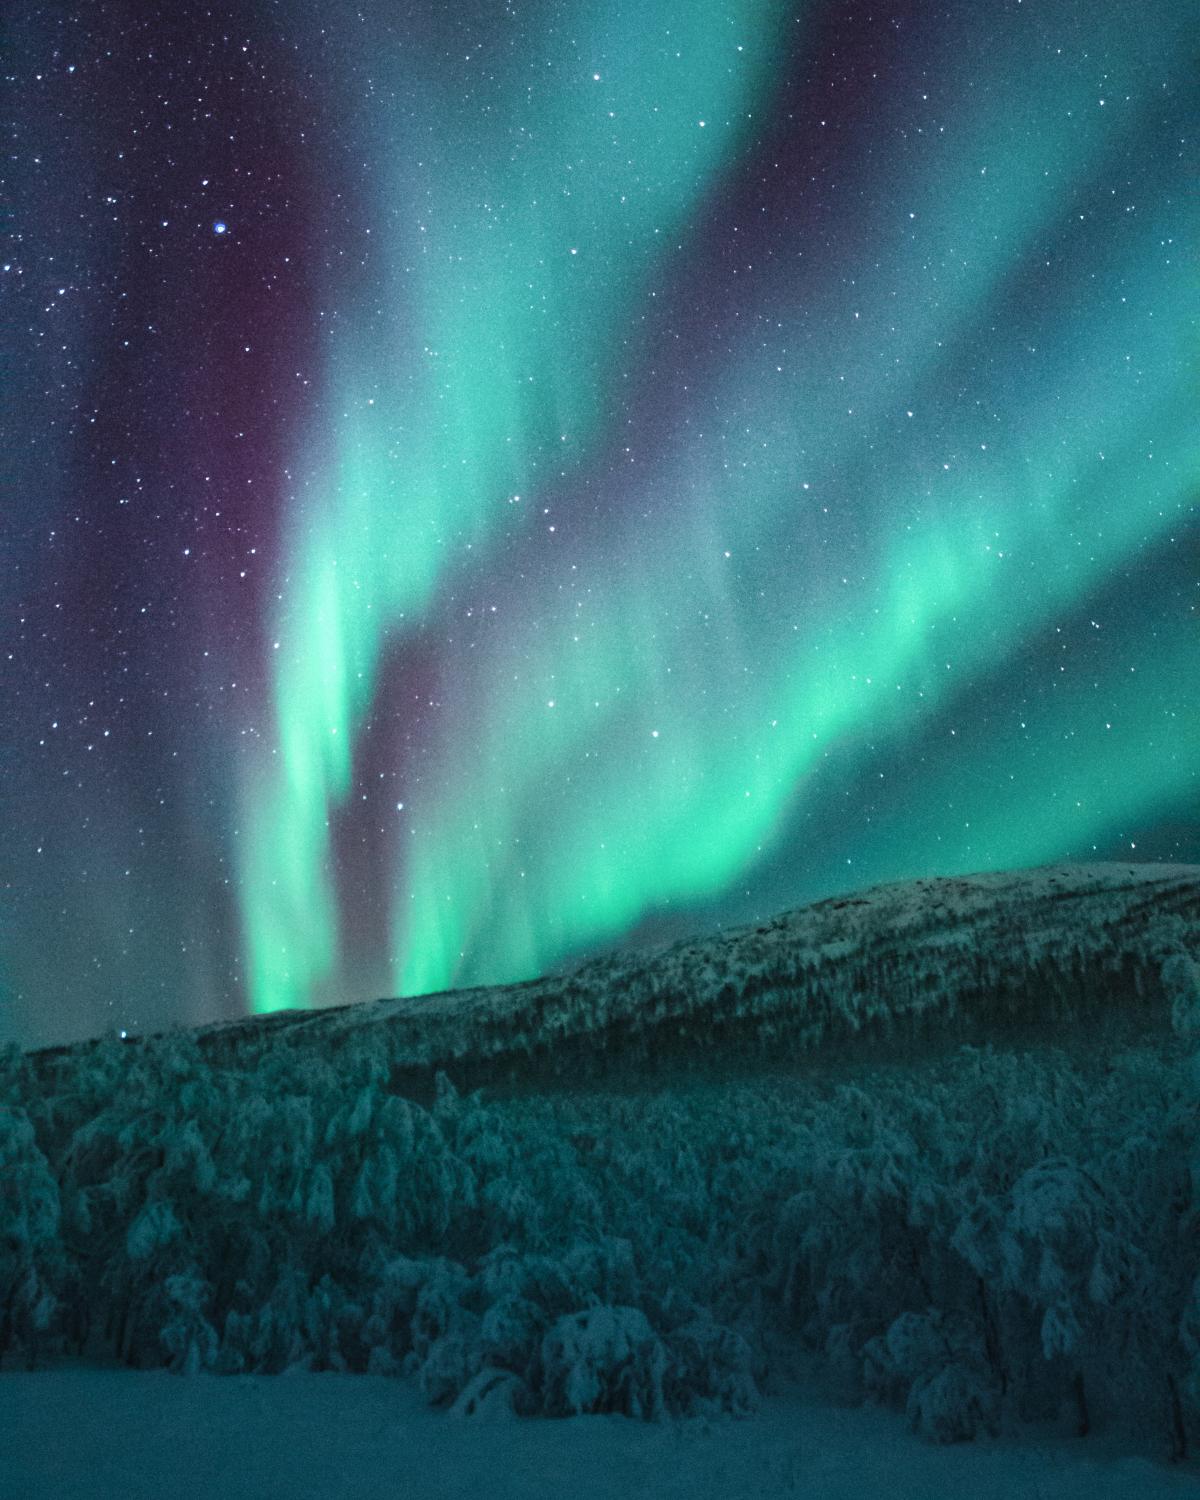
This is no accident, the motion of light emitting molecules is also governed by strong horizontal Coriolis deflection in the stratosphere. For other similar experimental observations see here and here.
Other experiments in rotating tanks can be designed to model the essence of the general circulation of the atmosphere, including its change owing to a decrease of the temperature contrast between the Equator and the Polar Region (i.e. in the presence of a climate change).